We're now shipping our Fluksometers with v1.1 of the sensor board. This board is a daughterboard that snaps onto a PCB containing an Atheros 2317 wifi chipset.
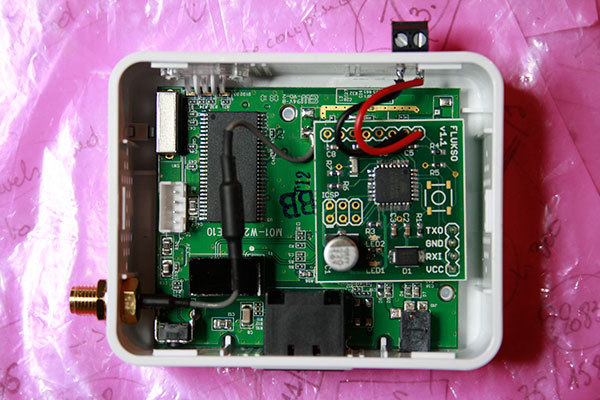 Fluksometer internals
The boards communicate via the UART TXO and RXI lines. GND and VCC offer a 3.3V power supply to the sensor board. The board layout image below contains annotations detailing the sensor board's most important functions. More information can be found in the Eagle schematic and board layout files in the Flukso repository. A pdf of the schematic is attached to this blog post.
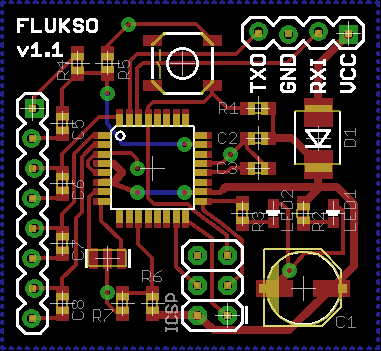 Flukso sensor board v1.1
We've also recently purchased a shiny new Rigol DS15052E 50Mhz 2-channel digital storage oscilloscope. You can see David Jones's rave review about it here. Besides being able to visualise non-repetitive signals, these DSO's also allow you save a screendump to a USB stick. We've put the Rigol through its paces by measuring the current clamp's output. The clamp's rectifier bridge creates a 100Hz ground tone with several harmonics as ripple on top of the DC signal. The image below shows the ripple in yellow. The Rigol's built-in Fast Fourier Transform calculates the signal's frequency spectrum (purple line in dBVrms). The first, second and third harmonic have been annotated on the image. The sensor board's A/D convertor samples the current clamp's signal at 488Hz. The FFT shows us that the third harmonic is sufficiently attenuated to prevent significant aliasing to occur at this sampling rate.
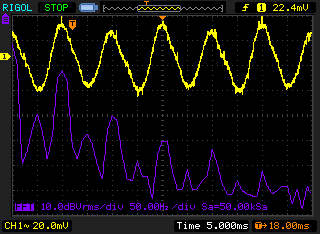 analog input signal
The second measurement shows the waveform triggered by a DIN-rail energy meter connected to the sensor board's digital input. This energy meter contains an open-collector transistor output which goes into a on-state for 40ms when 1Wh of energy has been consumed. By connecting the collector to the microcontroller's pull-up resistor to VCC and a debouncing capacitor to GND, we obtain a nice sharp falling edge. The pulse takes a longer time to restore to VCC due to the charging of the debouncing capacitor through the pull-up. These effectively form an RC circuit with a time constant of 4ms.
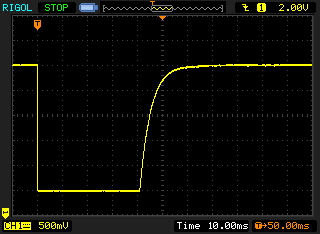 digital input signal
We have used the DIN-rail energy meter as a reference to benchmark a 1-phase and 3-phase Fluksometer setup. The chart below shows a 24h measurement of the setup. The Fluksometer closely tracks the reference signal, except for some overshoots. These can be partly attributed to the presence of inductive loads which will cause the Fluksometer to overestimate the amount of real power being drawn by the load. Other error sources would be a supply voltage deviating from 230V and the non-linearity of the current clamp, which should be limited to 2% across the clamp's dynamic range according to the datasheet. In this specific real-world test, we observe a 2% deviation of the average consumption for the 1-phase meter and 6% for the 3-phase one.
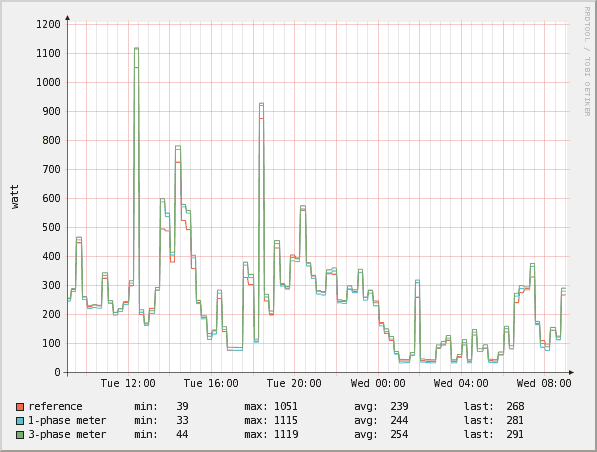 1-phase and 3-phase benchmark
| Attachment | Size |
|---|---|
| flukso.sensor.board_.v1.1.pdf | 35.85 KB |

Comments
Its good to know that this makes a certain gadget functions. A German sales ban on Samsung Electronic Co.'s Galaxy Tab 10.1N tablet was overturned in that European nation's courts on Thurs. Apple Inc. had continued to argue that the merchandise exploited the iPad. The court at first sided with Apple, but changed its mind when Samsung made a few layout changes. Article source: German court supports Samsung over Apple