Hey,
I love flukso, and I love my own server at home. :$
So ideal would be that I can combine both.
Sadly flukso sensors don't providing snmp out of the box (yet?).
I've wrote a small script that read each minute the sensors, and put the data in different rra graphs (based on the sensor ID).
You can find the script here as attachment. Comments are more then welcome (I'm not a scriptwriter, I'm a network guy).
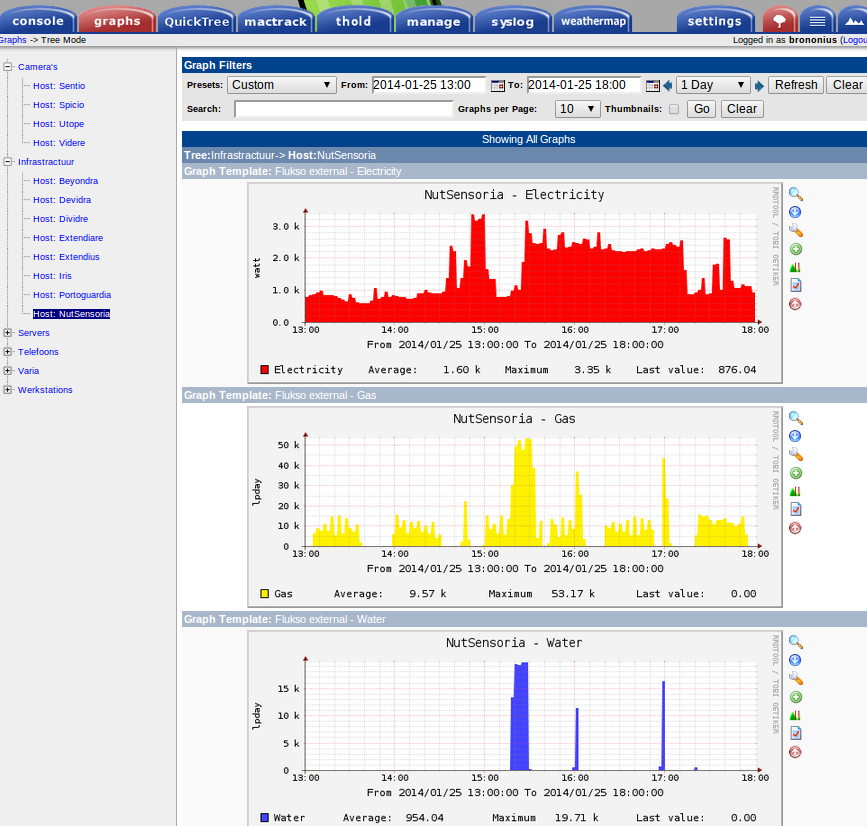
And after that, you can open the rra graphs with your favorite program (fe cacti, nagios...):
https://www.flukso.net/sites/default/files/Overview1.png
| Attachment | Size |
|---|---|
| fluksoGetSensors.sh_.bz2 | 1.08 KB |
Hi , glad to know
In Ubuntu there is a Nagios status monitor named Nagstamon. Can i try it with this program ?
How i use the file .bz2 you attached ? Is it not .tar.bz2 ?
I have to put my sensor ID's in it...
Can I run the file on my win7 pc somehow?
Thanks Baz
Just unzip the file. Hmmm, and remove the rubbish ____ behind it. Not sure from where that comes... :$
You should have a file with the name fluksoGetSensors.sh.
If wanted, you can rename this to whatever you want (except the .sh part).
Just make sure that the file is executable (chmod 755 fluksoGetSensors.sh).
When you open the file (with fe gedit or vi), you'll see a part 'some variables' where you should enter your configurations (fe IP, sensors, paths).
Once that is done, you can run the file manually. The script will reconnect each 59 seconds
And if you want to run it automatically when you reboot, you can put it in your crontab
fe /etc/crontab
@reboot root /scripts/cacti/fluksoGetSensor.sh > /dev/null 2>&1Not sure how you can run it in windows, or better, how it will react.
I've read a while ago about cygwin. With this 'third-party' application, you should be able to run shell scripts under windows.
Thanks Oniria,
I installed Cacti in Ubuntu desktop 13.10 and it came with a lot yes a lot of other files. So far so good.
The dialogue screen for configuration Apache2 ... i simply click OK on it.
But now, how i do open the Cacti app. itself ? Nope via terminal "cacti" or "fe cacti".
The file "fluksoGetSensors.sh" is already changed to my sensors and IP address and made executable.
The pads i leaved unchanged.
How do i run the file, with a double click on it ?
In /var/log/cacti i see three files that i can't open: cacti.log; poller-error.log and rrd.log.
They gave me errors when i try to open them.
In /var/www i see only one index.html file, no cacti/rra file.
I am a novice in server world, but install and use Ubuntu many years.
What did i do wrong ?
For cacti, there are several settings to check (apache & poller running, snmpd...). But basically, you should open it by a browser (http://yourip/cacti).
Are you running as root on your machine (fe sudo cat /var/log/cacti/poller-error.log) when you check the files?
When you don't have a /var/www/cacti, it means that your cacti installation is done somewhere else. If I'm not wrong, the last versions are located in '/usr/share/cacti/site'.
And the log path in the example script is maybe a bit wrong, it should be better fe /tmp.
But this is how you see it. So you should change the paths in my script accordingly.
Cacti is only used here to present rra files. The script just fills a rrd file.
Cacti itself doesn't do anything for flukso (since cacti is more snmp based). In the future, i'll see to create a script to generate the graphs directly with cacti, but for the moment, the script is more widely (also for nagios, mrtg, opennms, lighthttpd...). So you should configure/test these independently.
You can check fe if your rra file is filled with data using the command:
rrdtool dump /yourpathfromthescript/yoursensorid.rrd
Ok, i'm a bit further now:
I changed the pads in the file and checked them if they are there.
I open cacti in the browser where it asked for configuration a new installation. I changed nothing there, i checked only the pads if they where correct, click further, then it asked for username/password = admin/admin. I changed the password because cacti asked for it.
I think i have to change something in the console before i can see more than only Localhost in the tree-view in the graphs tab...
I looked in your print-screen with the flukso graphs but i have no idea what to configure.
Thanks for help,
Fluc
Another problem when i check if my rra file is filled with data :
ERROR: opening '/usr/share/cacti/site/xxxmysensoridxxx.rrd': Bestand of map bestaat niet
I don't see files under the pad /usr/share/cacti/site with sensor-id numbers ?
I know i'm almost there to see the graphs, but i'm a bit stuck here also.
Perhaps the script is not starting. It is just in my home file en is executable.
To start the script, you can simply enter sudo ./fluksoGetSensor.sh and it should keep running till your end it with fe ctrl-c.
For the rest, you should/could start it when you boot up the machine.
fe add following line (with your correct pathà in your /etc/crontab
@reboot root /scripts/cacti/fluksoGetSensor.sh > /dev/null 2>&1ps cacti won't show the graphs of your flukso out of the box. This will need to be added in there.
Cacti is a very nice monitoring tool that mostly is based on snmp request. But you can add almost everything you want (fe in my network: up/down of phones, IP-camera's, temperature, switchports, server health...)
Hi ONIRIA ,
Very nice script, I have it running on my Mac Mini Server and is creating the RRD file fine.
I am having trouble though creating a graph from the sensorid.rrd file - when I dump it I can see the data however I'm using MRTG but is complains with the following error if I try to display a graph:
RRD Error: No DS called 'ds0' in '/Applications/XAMPP/xamppfiles/htdocs/wx/c7c90d029e018769b5fb26380c369845.rrd'
I tried to use Cacti but gave up as it's too hard for me to get working on my Mac - do you have any insight please on how to display a graph?
Thanks
Ian
Sorry, but I don't have a lot of experience with MAC.
In linux, you can easily check the data with the command 'rrdtool dump ******.rrd".
fe "rrdtool dump 52f5c63cc9863fbbedcb498658a0a823.rrd | grep "2015-01-05 13:0"
should give you something like
1.6300000000e+02
1.6500000000e+02
1.6600000000e+02
1.6700000000e+02
1.6700000000e+02
1.6800000000e+02
1.6800000000e+02
0.0000000000e+00
1.2310000000e+03
1.7900000000e+02
1.6600000000e+02
1.6800000000e+02
1.2310000000e+03
7.8800000000e+02
Cacti is only the tool that i'm using to show the graphs. But if all goes well, you should be able to see the graph with any other tool that supports rrd. Somewhere, i've seen a small script to show the rrd graphs in a simple webpage. So i guess this is something more MAC related.... :$
Thanks Oniria,
Here is what my dump looks like .. do you think this is correct? If so, I'll try to graph it.
4.3000000000e+02
4.3800000000e+02
4.1600000000e+02
4.1100000000e+02
4.1200000000e+02
4.1500000000e+02
4.1400000000e+02
4.2200000000e+02
4.1800000000e+02
4.2200000000e+02
4.1400000000e+02
4.1200000000e+02
4.0800000000e+02
4.1100000000e+02
4.2600000000e+02
4.1000000000e+02
Oops .. I should have put this dump in code tags
Yep, had the same problem with this forum (dump code)...
Your results seem good.
So I would try now to show the rrd-files in a proper graph view... Cacti, nagios, html...
Success !!
My problem was that the DS is actually called "watt" and not DS0 ... when I changed MRTG to use watt instead of DS0 my graphs worked - thanks for your script!