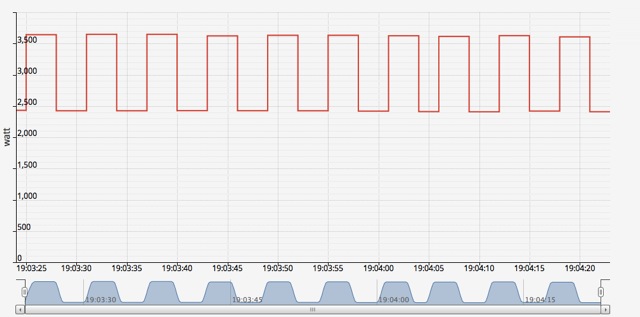
Now that I have the Minute tab working (thanks Roggy!), I find that the reading jumps up and down a lot, even when I know that actual power consumption is constant (or, at least, much more constant than suggested by the reading). I've attached a screen shot of the consumption in Minute mode. I see this up-and-down pattern at all levels of consumption, whether high or low. The reading jumps between high and low with every output. I see the same pattern in the Hour tab, just on a coarser scale.
The fluctuations are large, typically a little more than ±10% of what I assume is the real value.
I'm measuring consumption by monitoring the pulse output of my 3-phase meter (400 pulse per kW/h, that is, 1 pulse for every 2.5 W/h).
Does anyone know what causes these up-and-down readings?
Thanks,
Michi.
| Attachment | Size |
|---|---|
| Fluctuations.jpg | 48.3 KB |
The answer is in the number of pulses your meter delivers; the FLM counts pulses and computes the actual power consumption by multiplication of the meter constant and measured time between received pulses; in your diagram an average power of 90000Ws = 25Wh in 30sec is displayed (summing up the alternating 2400W and 3600W for 30sec) - at 1pulse per 2.5Wh this is 10pulses in 30sec what make a pulse frequency of 1/3 Hz (equivalent to the 3sec periods); so the alternation is caused by the very few pulses the FLM receives (that is, not in each 1sec measuring/integration interval) - it has to approximate corresponding to when a pulse occurs within a 1sec measuring interval; as it not may be exactly 1/3Hz you run into each third or second interval a pulse is counted thus get different watt displays...
Thanks for the explanation! Yes, that makes sense and explains it.
Hmmm… Why not use a different algorithm:
- Wait for a pulse and record the time it happened.
- Wait for the next pulse and record the time it happened.
- Divide the number of W/h per pulse by the time difference between the two pulses. That's the number of W/h per second. Multiply by 3600 and display that. (This will be dead-accurate to within the clock resolution.)
The difference is that, instead of a fixed sampling interval and averaging over that interval, the sampling interval would be variable and the updates would happen when a pulse arrives, with an accurate reading that represents the average consumption in the time interval between the last two pulses.
If the pulses arrive slower than, say, the refresh interval of the display (5 seconds for the minute tab, I think), assume average power consumption equal to the previous interval until the next pulse arrives. Then, when the next pulse does arrive, go back and adjust the preceding interval reading to match reality.
That would give a graph with variable step length instead of one with fixed step length. The advantage being that each step would be dead accurate, except for the last, possibly incomplete one, and that one would be adjusted to the actual value as soon as the next pulse arrives.
Any holes in that reasoning?
Michi.
Seems indeed like the minute tab can still use some finetuning... but it will need some serious thinking to implement this properly for all cases. I suppose flukso uses RRD technology (http://en.wikipedia.org/wiki/RRDtool), so you need to push the data regularly, and changing data afterwards isn't possible I think... so you need to delay pushing the data for 1 pulse if you want to be able to adjust the last measurement...
If your electricity usage is low however, you might only get one pulse per minute... and delaying a pulse in that scenario might make the minute view useless...
Anyway... there will surely be a solution that is satifactory for all scenarios...
BTW: I never saw this behaviour... but I suppose it only shows when you have relatively many pulses... With only one pulse every 20 seconds, (= "normal" usage in my case)... the effect of the sampling time versus the pulse frequency smoothes out this behaviour...
Yes, with what I suggest, you might have to delay pushing the data for a pulse until the next pulse arrives for it to be accurate.
I don't think that would make the minute view useless though. Consider: There is no data at all when there is no pulse. Suppose consumption is low and the meter pulses only once per minute. The minute view in that case is useless no matter what because, for an entire minute, there is no data whatsoever. Whether the Flukso samples once a second (or five seconds) or not makes no difference because there is nothing to sample, and therefore nothing to show. The best it could do is to show the data for the time in between the previous two pulses.
So, the minute view could be changed to update whenever there is a pulse. In that case, it would should the exact consumption for the period between the previous pulse and this one. And then it would not update at all until the next pulse comes along. Again, that makes sense, because there is nothing to update when there is no pulse.
When the pulses arrive faster than the refresh interval, it's no problem. Just show whatever consumption applies to the pulses that did arrive during the interval, averaged out. Suppose I get four pulses in the preceding five seconds. That's four consumption values that can be averaged to be shown as a single value or, if you want to be fancy, the five-second interval could actually should four steps with potentially different consumption levels and different lengths, depending on what time during the interval each pulse arrived.
I guess I'm suggesting that having a fixed sampling interval doesn't make all that much sense when the time between data points can be considerably longer than the sampling interval. So, instead, make the arrival of the data points your "clock", and adjust the display to show variable-length consumption steps instead of fixed-length ones.
Cheers,
Michi.
Be aware that the sampling should be (and is) separated from the way of display - the FLM just registers pulses with the corresponding timestamp (see main.c in the AVR section of the source code - there the interrupt routines just collect occuring pulses and store them), that is: to a certain time you know the number of pulses that have occured, thus the actual power equivalent available at a certain time as a sum of discrete "power quants" related to the meter constant; the display logic has to decide what to display from this information and even more, how to render the corresponding watt level; the minute tab reflects the power per second as a sum level reached (the more levels with less difference the better the "felt" accuracy), the vertical lines are "mathematically incorrect" as of course there is no level shift, but the jump to a different discrete value... So, what would be a better way to display the sum levels? Using splines would mean an "averaging" over a number of seconds, say 5, thus "less accurate as possible" and behind realtime... And with 5 second averaging intervals we again run into the "just 1 pulse every three seconds", so again an oscillation... The easiest way is using a meter with 1000pulses/kW or better ;-)
But these are just my two cents, best regards
Markus
I cannot imaging a 1000 pulse/kW meter helps... It might even be worse...
But... Bart knows how his code works... so probably once he is settled in his new HQ... he'll have a magnificent idea that humbles us all :-)...
I still don't understand these fluctuations. With my actual load constant at 300 W, I see a regular pattern of up-and-down steps of around 250 W and 350 W. That's a full ±20% deviation from the actual value, which is huge.
The data comes from the pulse output on my 3-phase meter, which pulses 400 times per kW/h, that is, one pulse per 2.5 W/h. At a load of 300 W, that is one pulse every 30 seconds. Or, to put it differently, a 1/10th of a second difference in arrival time of the pulse amounts to 1 W. I've taken a stopwatch and verified that meter pulses correctly. I see the LED flash once every 30 seconds, and the intervals are regular. (Certainly regular to well within one second.)
The Flukso should be able to measure arrival time of the pulses to within a small fraction of second, that is, the error in the readings should be no more than maybe 0.1 W, not 50 W.
It looks like the minute readings are around 500 times less accurate than they should be. Why is this?
Cheers,
Michi.
The AVR does tag the internal pulses with millisecond resolution. The fluctuations you're seeing is because of the meter constant not being a Wh multiple. See this forum post for an explanation. You will not get this behaviour with a 1000 imp/kWh meter constant.
PS: the unit for electrical energy is Wh, not W/h
Thanks for the explanation! And you are right, of course it's Wh, not W/h. (My meter is labelled "W/h", unfortunately. Just goes to show how much the manufacturers know about what they are measuring… ;) )
OK, I understand how this aliasing effect arises when the pulse rate isn't a binary fraction of 1 Wh. But that seems to be the wrong approach to me then. Look at it this way: if I have an absolutely constant consumption of, say 300 W, then the meter will pulse extremely accurately, and the Flukso, as you say, will pick that up with millisecond resolution. So, there is no reason why the Flukso shouldn't report absolutely accurate consumption. But, instead, I get these wild fluctuations.
So, why not change the way the pulse rate is converted into consumption? Instead of assuming a fixed amount of consumption and mapping that onto a time interval, accept that the time interval is variable and the unit of consumption is fixed, as determined by the pulse rate of the meter. That would enable the Flukso to tell me that it really is 300 W that are being reported by the meter, instead of getting this aliasing effect where, depending on which side of a fraction the pulse falls, results in those too-low and too-high readings.
Cheers,
Michi.
I agree that the real-time calculation is wrong when the meter constant is not a binary fraction of 1. The AVR takes care of the millisecond time stamping. It sends these time stamps together with the counter over an SPI bus to the flukso daemon in the Atheros SoC. However, the AVR only sends the integer values of the counter. Not the fractional ones. Hence the error/bug.
This bug managed to creep in because originally the FLM only supported integer meter constants. Then Fluksonians started to use kWh meters with 2000imp/Wh meter constants. Fractional constants were introduced, but the counter sent over the SPI bus was kept as an integer.
I've added this to the TODO list.
Thanks for the explanation and the TODO item :-)
If you could fix that with a firmware update, that would be awesome. Not only would make the Flukso better, it would also remove the need for me to poll the Flukso server at 0.5 second intervals to get an accurate instantaneous reading :-)
Cheers,
Michi.
> I've added this to the TODO list.
I just upgraded to version 223 (from 216), but the fluctuations are still there. Any chance that you could fix this soon? It would be really nice to have accurate readings with pulse meters that do something other than 1000 pulses per kWh.
Cheers,
Michi.
Here is another graph that shows the extreme fluctuations reported with 1000 pulse/kWh meter:
http://www.triodia.com/staff/michi/images/Flukso.jpg
Michi.
Oops, that's with a 400 pulse/kWh meter, of course.
Michi.
Please sign up for the r241 alpha release at this forum post.