Hi all,
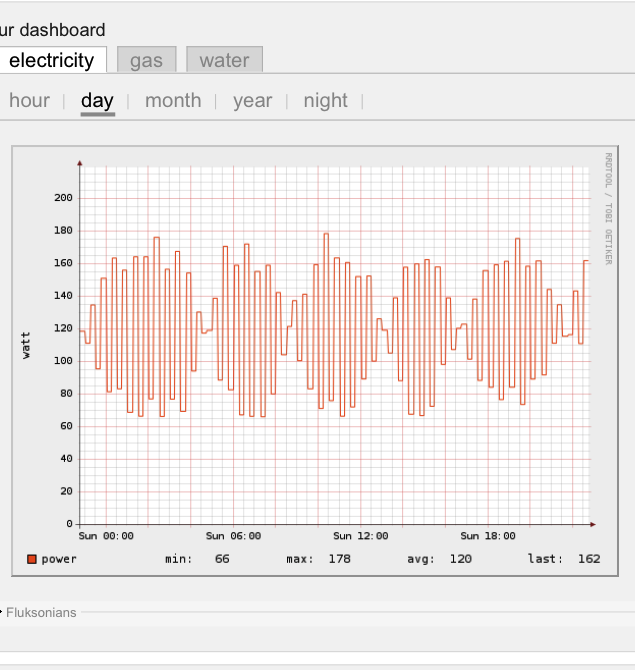
Somewhere around christmas I've started to see odd graphs for my flukso: odd sine-like behaviour (see attached screenshot). If this is not my flukso misbehaving, do you have any guesses what kind of device this is (I do have a suspicion) and what is wrong with it?
Cheers,
Maarten
| Attachment | Size |
|---|---|
| flukso_odd.png | 144.28 KB |
Hi Maarten,
Here is my understanding...
(I just spent some time to try to see how the metering works, so I might be wrong here)
From the graph, your average consumption is 120W.
The meter generates a pulse for every Wh used. It means that in your case, it would generate 120 pulses every hour, which is on the average 1 pulse every 30 seconds.
Since we have an aggregation per minute, you would get 2 pulses per minute; but again that is average, if you are slightly below or above, and depending on where your pulses fall in the minute interval, you might end up in getting 1, 2 or 3 pulses in the same minute -- which would explain why Flukso starts to draw nice XMas balls...
Greetings
--
Phil.
@Phil: Each Wh pulse is timestamped in the Fluksometer. Linear interpolation is used to divide the energy contents on minute boundaries. So a constant 120W consumption would result in a flat 120W line despite the variable amount of pulses occurring in each minute 'bucket'.
@Maarten: I can't give you a sensible explanation. Would you care to share your hunch as to what might be causing this type of graph?
Cheers,
-Bart.
A small update: earlier I thought this behavior was caused by a device in my house, but now I'm starting to think it is due to aggregation/sampling:
The new website and improved charts are great and allowed me to have a more careful look on what is happening here. I can now select the the same time period for both the hour and day aggregation level. The interesting bit is that in the day aggregation level (one measurement each 15 minutes) there is a distinct sine-like behavior, but in the hour aggregation level (one measurement each minute) there is no such shape. There is however a block pattern that has a period of 30 minutes (probably my fridge), which I suspect to produce the sine-shape in the day-aggregation level. I would have liked to upload some screenshots to illustrate this, but currently this forum gives an error when I try to attach something ("An HTTP error 0 occurred. /upload/js").
What do you think, does that make sense?
Maarten