Gday All
Ive been getting some very unusual readings with my flukso. Its a single phase with a 2nd clamp for monitoring my Solar PV output.
Ive been getting some very unusual spikes & dips. The red trace is main power consumption & blue trace is solar PV output. You can see how sometimes they both seem to follow each other, even though they should be totally seperate.
The main clamp is around 5 - 6 wires going to all the circuit breakers for the lights, air conditioner, stove, power points, the PV clamp is around the single wire from the inverter so its wired in correctly. It almost looks like induced noise but there are no parallel runs to power cable. Its really all over the place for some reason!!
Could clamping over whole bunch of wires cause this? Anybody got any ideas?
Thanks!!
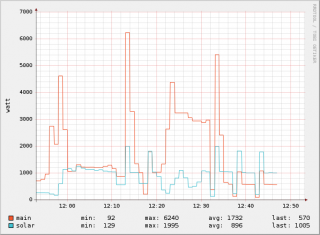
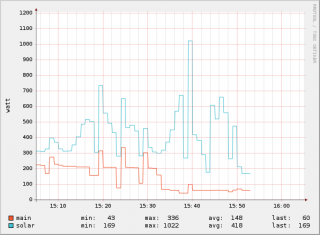
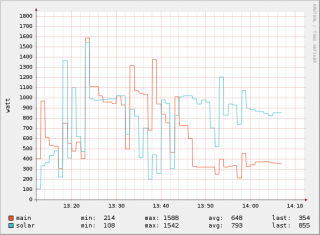
Given that there is a drop just before the spikes, it looks like a data reading was delayed. This shows in the graph as a dip in the graph where the data was missed, followed by a peak of the same height when it was included later. If there is a delay in the reading, it could easily affect both channels at the same time.
When I had my main clamp around the too many wires, I suspect the clamp wasn't closing tightly enough, and it read about 50% low. A few wiring changes, and putting the clamp where there was more space fixed it. It now reads about 10% above, which is reasonable given I've got fluorescent lighting without power factor correction.
Thanks for your help.
A delay in reading makes sense. I had noticed that each peak was the same height as the dip. What would cause it? How to remedy it?
The clamp is snug, but can rotate freely around the wires.