In the "Flukso would need section" there was a debate on applications (Android, iOS, HTML5) to visualize FLM readings - see https://www.flukso.net/content/home-display-android-app
This request partly is solved by installing the FLMlocal tweak, but still lacks some more simplicity, e.g. the direct visualization on supply and consumption in a decent outline.
As this request could be fulfilled by adding "just another tab" on the FLMlocal visualizations, it is yet to be figured out on how to efficiently define (and store) information on the actual direction of (energy) flow.
At the moment I can imagine to spend a "direction flag" on input data, either on the display itself (would require a cookie to keep settings) or better already in the device configuration - but this is just a thought.
So, let's open up a solution discussion on how to increase user experience on FLM data visualization.
First requirements though:
REQ-FLM-SIMPLEVIZ-1: FLM (power) sensors shall distinguish direction of flow, thus define either supply or consumption.
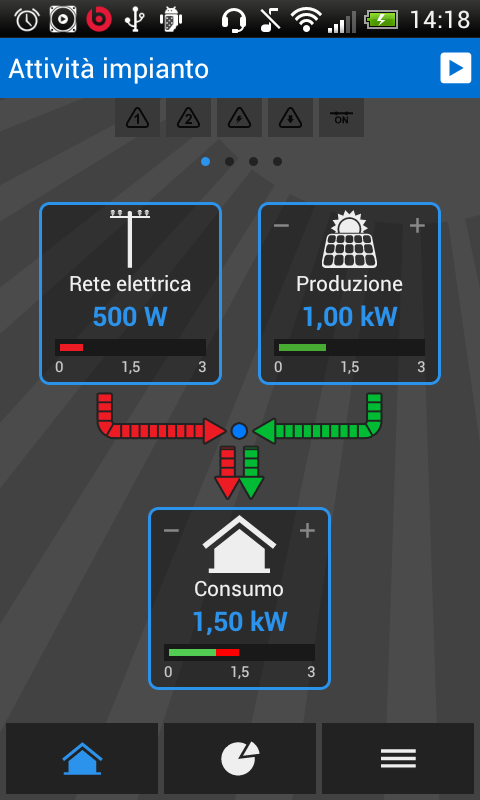
REQ-FLM-SIMPLEVIZ-2: An FLM simple visualization shall show consumption, supply and a combination/total of both (refer to attached picture by TOMMYVILLE). Note: For production fed back into the grid also a feasible display is required.
By the way: You don't have to tweak your Fluksometer to test this; you may have a look at all this also on your (Linux/OSX) desktop - follow the white rabbit...
| Attachment | Size |
|---|---|
| my_Solar_Energy_screenshot.png | 56.79 KB |
| ConsumptionView.png | 216.74 KB |
Based on the FLMlocal implementation I made an experimental solution; please see https://github.com/gebhardm/flmlocal/tree/consumptionview#show-simple-co... - not nice yet, but growing...
Thank you! I am trying to upload to my Flukso now, unfortunately I can no longer SCP or SSH into it for some reason, wonder what I broke yesterday :(
Trying to avoid doing a factory reset, I have found instructions on this forum how to reload firmware if worst comes to worse.
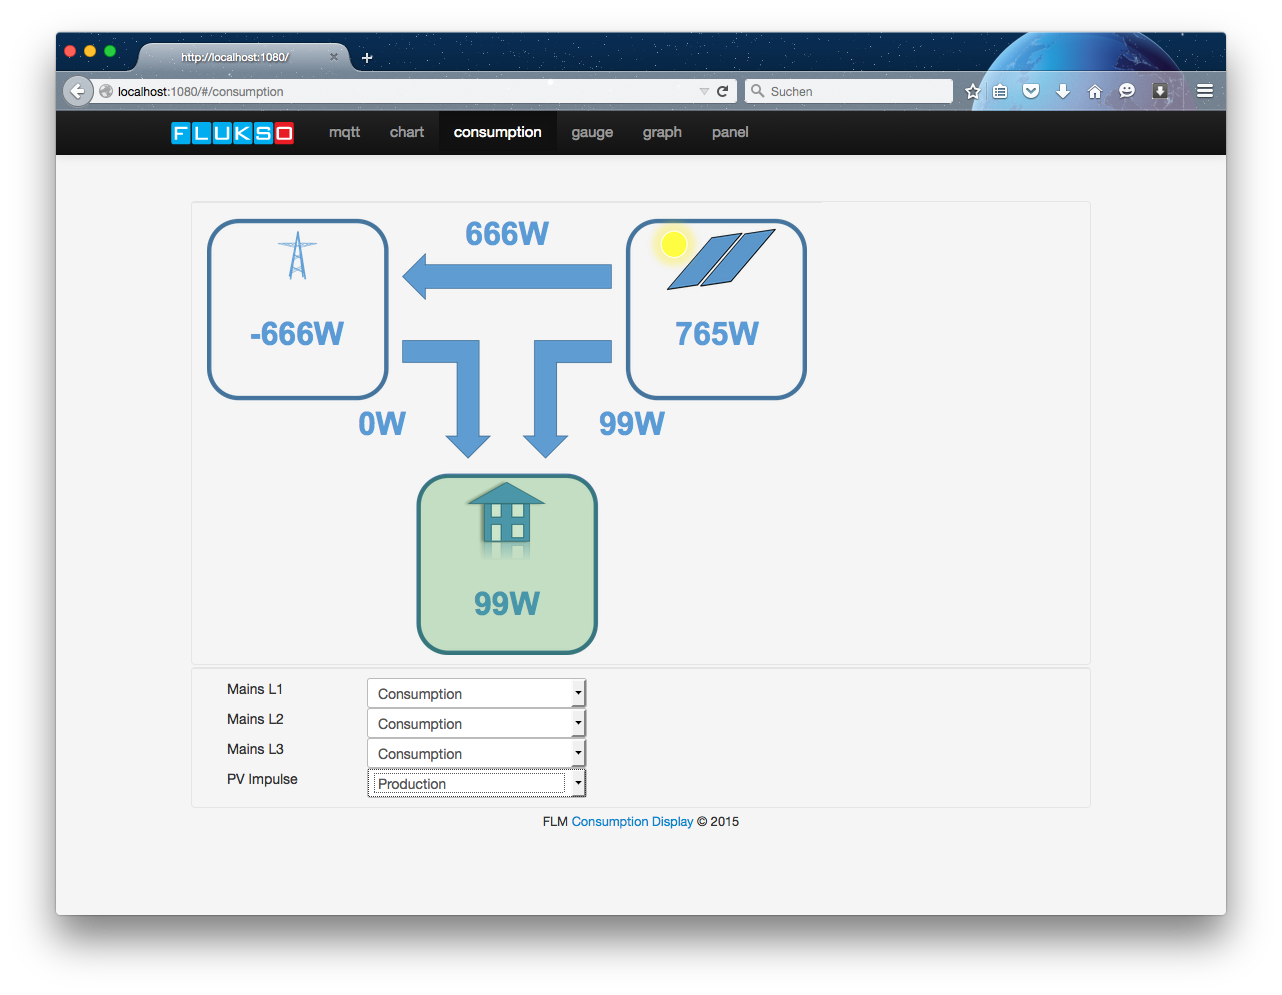
Tommyville - test it on a desktop first; the consumption view just requires access to the MQTT broker; see https://github.com/gebhardm/energyhacks/tree/master/Flukso#testing-flmlo...
I like this idea guys. I have a not so pretty .php script written by someone else that I have modified for my purposes. The data for consumption/generation is obtained in real-time from the FLM - Note that I do not currently have Solar connected so it will not show generation. This is supposed to emulate the Watson device - it is Red if Importing and Green if Exporting. Arguably, this is all we really need in a simple "monitoring" screen that is child/family/wife friendly and easy to read - if It's Red then you have too many things turned on etc.
Here is my website running this now:
http://wx.theshackbythebeach.com/wx/power.php
Thanks, VK2HIM, this is even simpler; how/where do you configure what is consumption, what production? I bet, it is in the code, isn't it? I hear already the "guys without programming experience" screaming ;-) (therefore I'd like to have it on the sensor configuration page - icarus75 to adopt)
Going away from any graphics to pure wattage display and a color code (happy section 508 accessibility ;-)) I could live with, but can others?
Who else has an opinion?
Yes, production/consumption comes from .php reading Sensor direct - similar to mqtt data I guess? Here is the relevant code section:
Perfect, thanks; this is then feasible only, if consumption and production run into one sensor end-point each. Which brings the next requirement:
REQ-FLM-SIMPLEVIZ-3: An FLM simple visualization shall detect all available sensors and aggregate their readings corresponding to flow direction. Note: This implies that wattage is accumulted, not temperature, of course ;-)
This is because three-phase-sensors first need to be combined into just one, without losing the capability to distinguish by phase (what my simple hack already does).
Led by the given demands I played a little further and exchanged the actual visualization of the flow overview; this is inspired also by an installation seen at the County Garden Show in Landau/Palatin that has a PV and cunsumption setup to exlpain to kids at hand (actually with distinct LCDs for the different partitions). See the second image attached to this forum post.
By the way: The image itself is rather scalable, so should the displayed values be; but until now I am not able to put the "position:relative" right... Please, you UI designers, provide me a hint. Also the extending navigation bar is not that nice, so what actually to through out (or make configurable) there?
All in an own branch for now at https://github.com/gebhardm/flmlocal/tree/consumptionview
Wow thank you! Very nice, and much sooner then I expected! I will play with this and provide feedback.
An idea for the navigation bar (it didn't fit on an iPadAir2 screen before consumption was added) would be to add check boxes (like the ones under services) to be able to enable or disable (hide) items.
Bonus of this is could keep people from accidentally changing settings and saving them. On a dedicated display I would then hide status, wifi, sensor, kube, services, syslog, mqtt. But guess then it either needs hiding every time, or a cookie to save settings.
Don't know if that's possible or not or how hard it is too implement, I'll leave that up to the designers/coders, who probably have better ideas anyway. Just putting ideas out there for discussion.
Or it needs to be able to scroll (drag left and right), but guess then can hear them screaming it needs to do it behind the Flukso so not to hide the logo.
I like this Marcus, although my solar system is not yet commissioned, it is working fine for consumption and is exactly what I need. Many thanks, I will test further with iPad display for real-time monitoring
Regards
Ian
Next version to test :-) - I moved all menu items into corresponding dropdown menus; so there is only a configuration and a visualization menu visible that on click offer their respective content - this solves the recent overcrowding.
See commit 26a1c7a for respective changes.
As the dropdown navigation works as intended also on my FLM, branches 'master' and 'consumptionview' again in sync - https://github.com/gebhardm/flmlocal - Bart, FYI :-)
Next step is making the consumption view scalable.
Now, how can I glue this iPad to the wall? Thanks again Markus!
I like the cascading menu to reduce the overcrowding!
I'm thinking that the section at the bottom where we can label each sensor as consumption/production will not be needed to be seen once it is configured correctly? Maybe we could have one more page that only displayed the visualisations without the gauge setup section which could be left running on the iPad and will look cleaner?
Thanks
Ian, as written, the sensor direction should be subject to the sensor configuration (which is nothing I will lay hands on, as this would increase maintenance effort for me exponentially); the config at the bottom also provides a lot of opportunities when playing with different setups (thus showing "what if" cases)... Maybe (sic) I find an option to toggle the display of the respective section (running through the different chasms of AngularJS cost me six hours just on this "tiny" adaptation - just to give you an impression that even a hobby may be hard work).
Oops, wifi/sensor config was missing - corrected, please update. Good, that it is experimental ;-)
Thanks Marcus - much appreciated!
Hi Ian - here you go (you are right, of course AND there is a possibility AND I am also eager to get it nice ;-)); the "next" version now scales the image appropriate to the available space AND offers a feature to toggle the configuration in your requested sense; for that see the "little addendum" in the copyright line. I hope, this pleases ;-)
Best regards to "where the people live upside down"... Markus
I'd rather call this finished for now.
Thanks for the hard work Marcus - this is perfect, exactly what I was looking for! Many thanks from down under mate! Yes, this is finished!
Cheers
And here is my WordPress advertisement for this solution: https://energyhacks.wordpress.com/2015/08/30/better-understanding-consum... - including a picture on how it finally looks on a Mac in Safari :-)
<eot>To complete the records, there seems to be an Australian side-discussion in http://forums.whirlpool.net.au/archive/2347494 with the quotable comment
"I remember reading in some article that the biggest changes to energy behaviour come from a visible display (like WATTSON) that people see all the time, rather than historical graphs that people check for a few days/weeks while they are excited about a new solar install, and then quickly forget all about."
So this asks for making (at least) this kind of visualization standard to the Fluksometer - @icarus75, your opinion?
Thanks heaps for your efforts for this. I followed the instructions on the whirlpool thread (whrl.pl/RenMiE) as words like 'git clone' go way over my head. Cheers!
Well, the explanation is just one click away - "Git is easy to learn and has a tiny footprint with lightning fast performance." - I would wish, everyone is eager to expand her or his horizon. This is just like Math, which is also for girls no issue; Margot Gerritsen and Maryam Mirzakhani prove this, not exceptionally...
Note: I cleaned up the flmlocal repository; as the consumptionview branch is merged into master, I deleted it again. Any link to "consumptionview" thus raises a 404 error; go to "master" instead - and use "git" :-)
Hi Marcus, Sorry to resurrect this thread - I was hoping you may be able to help me please with your consumption script to cater for a change I made to my Flukso yesterday? Previously I was monitoring Consumption and Production using Pulse inputs and this works great. Yesterday I added a CT clamp to measure my Hot Water electric consumption as a seperate chart - this works fine on the main Flukso dash but it has caused a problem with the consumption script, basically because the Hot Water usage is already included in the Consumption pulse meter so the Hot water is being counted twice in the consumption script. I believe the "fix" is to have an option in the configuration page to "ignore" the hot water CT sensor as the only options are Consumption and Production. I looked at the script but I don't know enough on how to add a new option to ignore a sensor. I'd appreciate if you may consider adding the "ignore" option to the script. Many thanks - Ian
Hi Ian,
nothing easier than that - it is really just adding an option; see https://github.com/gebhardm/flmlocal/blob/master/www/scripts/controllers...
Code is updated, so pull/fetch the update and copy the new consumption.js script file to your flukso.
Kind regards and merry christmas.
Markus
scp consumption.js root@<flukso IP address>:/www/scripts/controllers/consumption.jsfrom the folder the (new)consumption.js-file is stored in... (or perform the change manually on the FLM itself usingvi- if you can do this, then nothing is too difficult ;-))Thank you Markus - that was very quick :) .. I shall try this in the morning as I am just about to go to bed - Merry Christmas to you too!
It's working perfect, thanks again Markus!
Hi,
i have installed FLMlocal using the zip file and winscp (id like to get it up and running before trying to learn git) and due to the lack of time that was the easiest way. I seem to get myself into trouble with all the linux code etc.
anyway i now have the visualization tab with chart, consumption,gauge, graph and panel.
Chart displays "query request sent" but nothing happens
Consumption just shows 0w in everything
Gauge shows - ow nothing on the gauge and the message - "Latest MQTT message: /sensor/(sensor id here)/gauge, [1454901996,184,"W"]"
Graph is just a black rectangular outline with nothing showing in the graph
and Panel shows Main
2/8/2016, 1:58:21 PM
0 W
Total 5.959 kWh
Latest MQTT message: /sensor/(sensor ID here)/counter, [1454902101,5959,"Wh"]
what have i done wrong?
flukso is working and updating to the dashboard and i can see the minute and hour tabs working
The query shows values only if the query daemon is installed (for the experts only ;-)) - https://github.com/gebhardm/flmlocal#querying-tmpo-data
The other views, panel and gauge, provide a "latest MQTT message" section; this should update automatically with the incoming messages.
On all occasions, make sure you cleared your browser cache when starting to use the views - there partly is a hassle with with not-up-to-date javascript libraries - for example the mqtt-library that comes native with the FLM to make the MQTT tab work - does this one work (Configuration -> mqtt: this is basically the same underlying functionality as for the visualizations)
By the way: If you can see the chart etc. you made a pretty good job so far.