In the "Flukso would need section" there was a debate on applications (Android, iOS, HTML5) to visualize FLM readings - see https://www.flukso.net/content/home-display-android-app
This request partly is solved by installing the FLMlocal tweak, but still lacks some more simplicity, e.g. the direct visualization on supply and consumption in a decent outline.
As this request could be fulfilled by adding "just another tab" on the FLMlocal visualizations, it is yet to be figured out on how to efficiently define (and store) information on the actual direction of (energy) flow.
At the moment I can imagine to spend a "direction flag" on input data, either on the display itself (would require a cookie to keep settings) or better already in the device configuration - but this is just a thought.
So, let's open up a solution discussion on how to increase user experience on FLM data visualization.
First requirements though:
REQ-FLM-SIMPLEVIZ-1: FLM (power) sensors shall distinguish direction of flow, thus define either supply or consumption.
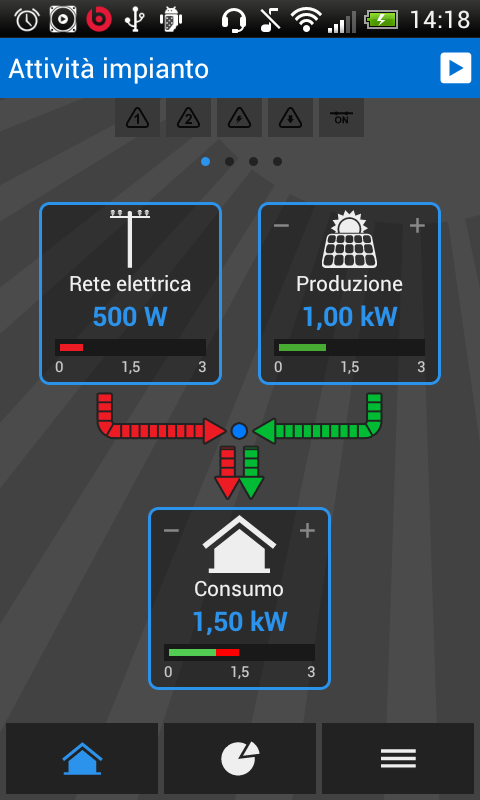
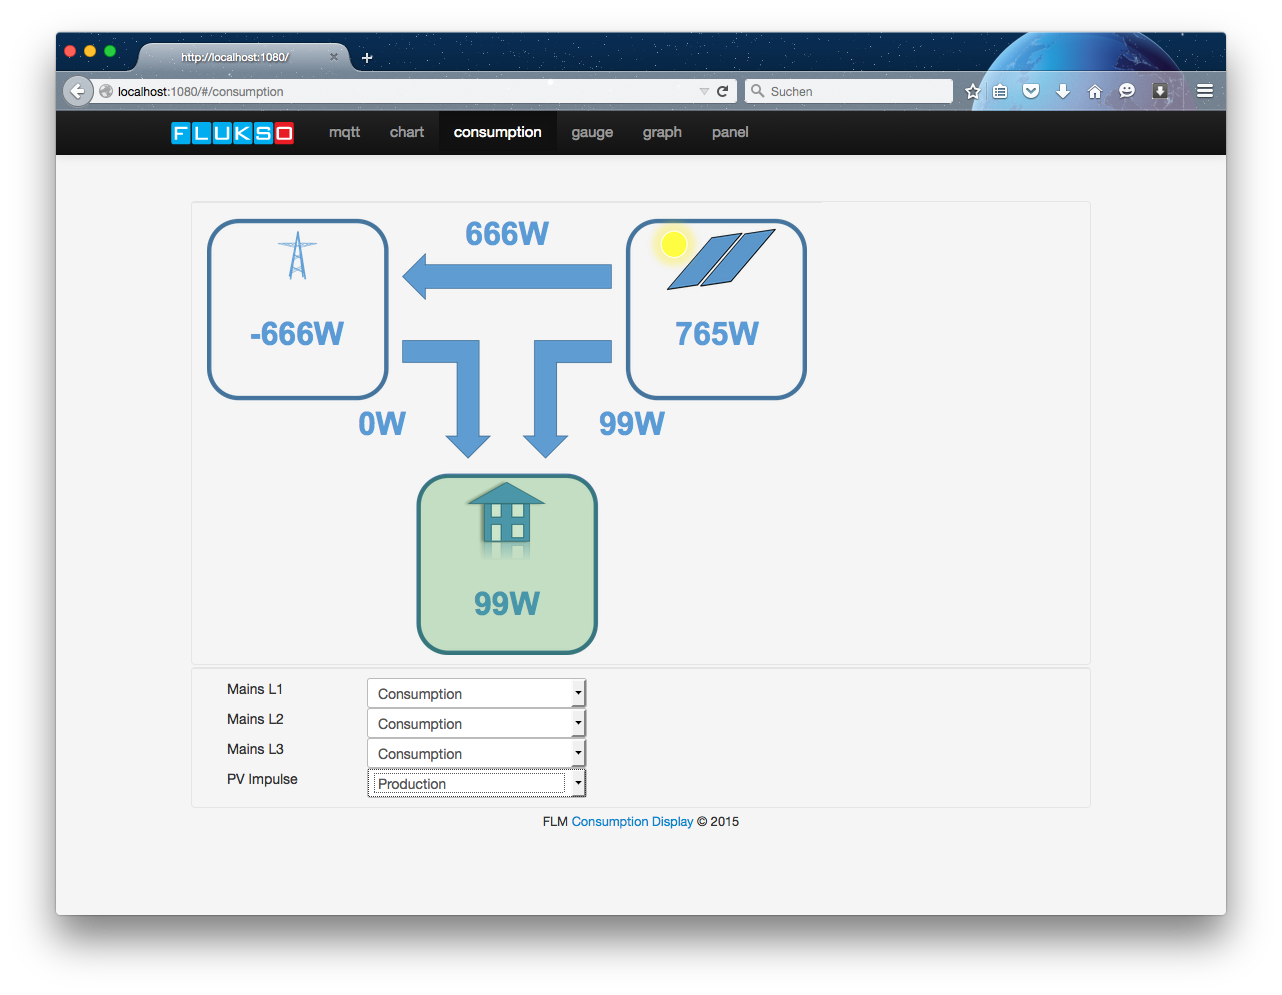
REQ-FLM-SIMPLEVIZ-2: An FLM simple visualization shall show consumption, supply and a combination/total of both (refer to attached picture by TOMMYVILLE). Note: For production fed back into the grid also a feasible display is required.
By the way: You don't have to tweak your Fluksometer to test this; you may have a look at all this also on your (Linux/OSX) desktop - follow the white rabbit...
| Attachment | Size |
|---|---|
| my_Solar_Energy_screenshot.png | 56.79 KB |
| ConsumptionView.png | 216.74 KB |
I can't emphasize it enough - see the "how to" https://github.com/gebhardm/flmlocal/tree/master/howto - it is really just copying the content of www/ onto the FLM's www-folder, then everything is at its place (as long as Bart does not provide another update).
i did follow the how to and yes i did copy the www/ folder to www on the flukso
this is whats happening even after a cache refresh in chrome
https://dl.dropboxusercontent.com/u/58260317/Flukso/1.PNG
https://dl.dropboxusercontent.com/u/58260317/Flukso/2.PNG
https://dl.dropboxusercontent.com/u/58260317/Flukso/3.PNG
https://dl.dropboxusercontent.com/u/58260317/Flukso/4.PNG
https://dl.dropboxusercontent.com/u/58260317/Flukso/5.PNG
but data is updating fine on the dashboard and the minute tab does work
https://dl.dropboxusercontent.com/u/58260317/Flukso/Dashboard.PNG
I assume the "Latest MQQT message" values change every few seconds? if so, the scripts are working, it's just the graphing that's not working properly.
It may be a few hours until Marcus replied as he is in Germany, in the mean time have you tried a) Using a different browser other than Chrome b) tried a different computer c) Download all the files again from github and copy to FLM again d) power off/on the FLM?
"I assume the "Latest MQQT message" values change every few seconds? if so, the scripts are working, it's just the graphing that's not working properly."
yes that is correct values change but nothing displays
It may be a few hours until Marcus replied as he is in Germany, in the mean time have you tried a) Using a different browser other than Chrome b) tried a different computer c) Download all the files again from github and copy to FLM again d) power off/on the FLM?
a) yes tried firefox still the same
b) yes tried phone and other computer both running chrome. interesting fact chart doesn't work but all the rest do on the other devices
c) have not tried
d)yes powered off multiple times
so why does chart not work and then everything not work on my main pc?
Now step-by-step:
- From the linked screenshots, everything looks fine so far; there should be no difference between Chrome or Firefox; there is no power cycling necessary for the FLM!
- FluskoChart: As written, leave the chart out for the moment, this needs an additional installation step and activation on the FLM itself.
- The label "Main" is shown, so the configuration is correctly determined; a sign that the controller scripts did load properly and the MQTT channel seems to work.
- FluksoGauges show the gauge, so the "justgage" lib loaded properly
- FluksoPanel does not show the sparkline in the center; so there is something wrong
- FluksoGraph shows the graphing area, but no graph; so there is something wrong
You did not really answer the questions raised:
- Does the "configuration -> mqtt" show the incoming MQTT messages continuously?
- Do the "Latest MQTT message"-panels update once per second?
- Did you clear your browser cache?
- What does the "Console" of the browser say? Do a right-click on the browser window and choose "inspect" (Chrome) or "inspect element"(firefox) - chose the Console tab and see if there is an error message.
I still assume that one of the required libraries did not load properly.
"b) yes tried phone and other computer both running chrome. interesting fact chart doesn't work but all the rest do on the other devices"
So it works, doesn't it? I assume it is a "cache clear issue" on the PC's FF.
And again: The chart requires the installation and running of the query-daemon; for that see https://github.com/gebhardm/flmlocal#querying-tmpo-data - this is an additional functionality "at the heart of the FLM". If this is installed then use the defined/"defaulted by refresh" outline of date and time to transmit.
You did not really answer the questions raised:
- Does the "configuration -> mqtt" show the incoming MQTT messages continuously?
- Do the "Latest MQTT message"-panels update once per second?
------ yes
- Did you clear your browser cache?
----- yes, i have re cleared it closed it opened it recleard it again and still doesnt work.
- What does the "Console" of the browser say? Do a right-click on the browser window and choose "inspect" (Chrome) or "inspect element"(firefox) - chose the Console tab and see if there is an error message.
no error message
"allow right click initializing for http://192.168.***.***/#/
rightclick.js:19 allow right click not applied because the domain name matches google|yahoo|192.168.***|localhost|"
I still assume that one of the required libraries did not load properly.
that would then mean it wouldn't work on any device would it not?
"b) yes tried phone and other computer both running chrome. interesting fact chart doesn't work but all the rest do on the other devices"
So it works, doesn't it? I assume it is a "cache clear issue" on the PC's FF.
i have done a clear cache multiple times unsure if there more than one cache or something?
No idea; the "rightclick.js:19 allow right click not applied" I do not understand as I want you just to open the debug view of the browser itself and let you check if there is an error; do you have a "no-script plugin" active on your PC? There are too many possibilities ... Let somebody take a look on site...
the right click is a right click chrome extension to allow right click on pages where it's disabled.
https://dl.dropboxusercontent.com/u/58260317/Flukso/Console.PNG
I have installed IE 11 and still have the same issue with all browsers on this computer
I don't have a no script running on the pc that i'm aware of.
I have tried chrome IE and Firefox and none work on this PC so imo something relating to this pc/
what actually makes the graphs show? knowing this I might be able to work out whats causing it to not work.
"What makes the graphs show" is a transfer of the received MQTT messages into the corresponding data series arrays and then a call of the respective "refresh" function
- FluksoGraph: https://github.com/gebhardm/flmlocal/blob/master/www/scripts/controllers...
- FluksoPanel: https://github.com/gebhardm/flmlocal/blob/master/www/scripts/controllers...
- FluksoGauge: https://github.com/gebhardm/flmlocal/blob/master/www/scripts/controllers...
- FluksoConsumption: https://github.com/gebhardm/flmlocal/blob/master/www/scripts/controllers...
So if the backgrounds and mqtt messages are working.
Is java script used to display these?
I can run other java script things whats stopping it on this PC?
Sorry to insist, PEBCAK? This is actually not the PC pastoring, the code is available and there are plenty of js tutorials out there, so at some point you need to help yourself. So for me
<eom>well sorry for not being technically minded in javascript.
its working on the other pc's so there's something on this pc stopping it.
i have run 3 different browsers , cleared cache, run without any addons ran incognito mode.
im not asking for you to fix it but was looking for advice in whats happening and what is used to create the graph, either some or all of the javascript isnt working. seems strange that my HTPC is an exact copy of this chrome and works fine.
ran a virtual pc on the one that doesn't work and works fine so appears it something on the pc. a reformat might be the easiest way to hopefully fix it
virtual pc now does not work,
cleared cache and still doesnt work.
you wouldn't believe it,
it just started working randomly, it wasnt working and i'd left the page open, come back an hour later and it's filling the graph with the usage.
I'm stuck on the next bit.
Querying TMPO data
i have copied the query.lua file to the /usr/sbin folder on the FLM using scp
opened putty and ran
"lua /usr/sbin/queryd.lua &" returns - " unexpected symbol near '<' "
As an alternative you may install this also as a "real" daemon by adding a symbolic link
then tried
"ln -s /usr/sbin/luad /usr/sbin/queryd " worked as expected
"/usr/sbin/queryd -u flukso" returns - "Daemon returned 0 as return value."
-ash: Daemon: not found"
does this require a reboot? chart doesnt seem to work yet
No reboot required; check the ownership of the respective files - they should be the same as, for example the
/usr/sbin/tmpodand/usr/sbin/tmpod.lua- adapt withchown, if necessary. Note that in this setup on reboot you manually have to restart the query daemon (or you alter the flukso.init file as in the pull request)Note: As any .lua-file is a plain text file, there should be no codepage artifacts in there (wrt "unexpected symbol"); windows still seems to not do this right sometimes...
ok cheers,
Have it working now.
re downloaded files re copied, and re ran script.
editing the init file looks a bit out of my league and worried about stuffing it up. what would happen if i did break the flukso.init file?
would i have to setup git to do the pull request to edit the flukso.init or could it be done manually?
(i have no git experience) but would love to set it up at some stage
Two options:
* The save one: You may edit the
flukso.initfile manually using the FLM-nativevieditor or edit it via the (win)scp path (save to windows/operating system of choice, edit, reload to FLM, reboot). As this does not change the factory default with any factory reset you are able to return to delivery state of your fluksometer.* The potential, yet untested one: Take https://github.com/gebhardm/flm02/blob/tmpoquery/openwrt/package/flukso/... and copy/(win)scp this in place of your fluksometer's
flukso.init. Remember the factory default retrieval :-)Copy your "old" flukso.init to
flukso.init.oldto potentially get it back easily before overwriting or editing it.The git pull is just a marker that I'd like to see this functionality in the standard delivery (what seems still just wishful thinking) - this is another story.
Ok thanks for your patience.
I might try editing it manually when I have a bit of time to spare.
Thanks back to you, B-Man, for using my stuff - this is actually what keeps the community alive;
Hello community, it gets a bit lonely out here; no hacks, no ideas, no discussions?
Hi Markus, i using you flmlocal visualizations script à few months now and it is working very well.
The only this is not working yet is the FluksoChart.
The FluksoChart is also just one SCP and one SSH-start command away:
/usr/sbinof your Fluksometer.lua /usr/sbin/queryd.lua &Then at least you can check the chart until your next Flukso-reboot (as the query service in this way is not started automatically - for this the flukso.init must be changed)...
(ref to https://github.com/gebhardm/flmlocal#querying-tmpo-data)
Ok thanks, i will look for it
Earlier this year B-Man reported a problem where one of his Windows PC wouldn't display the graphics on any of the visualisations. Co-incidentally, this started happening yesterday on one of my Windows PCs - this PC had worked fine previously. Restarting, clearing cache, using different browsers (ie and Chrome) make no difference, it's quite strange. This screenshot shows that the mqqt messages are being received, it's just the graphs/gauges on the page are not updating.
https://dl.dropboxusercontent.com/u/24331645/Image%20001.jpg
Glad it's not just me. I don't feel so silly.
thats exactly what mine was doing.
do any other devices work?
mine just randomly started working after leaving it on the screen for an hr or so.
I'm not sure if I had rebooted the router or was on another device accessing the flukso via ssh.
I hope you can find what's causing it
Well just as oddly, mine started working all of a sudden without me needing to do anything. I'll blame it on Windows lol
I would rather blame the Javascript engine of the browser; if it happens again, please check in the "debug view" of the browser (context menu -> query element -> console) if there are any error messages as I did not experience any issues (I just reuse existing libraries)
Interesting observation Marcus, I'll try that next time if it reoccurs. Since I had the same issue with two different browsers - would this mean that both Browsers share the same Javascript engine?