Troubleshooting
This section lists a set of pages on the local configuration interface that will help you troubleshoot a Fluksometer installation.
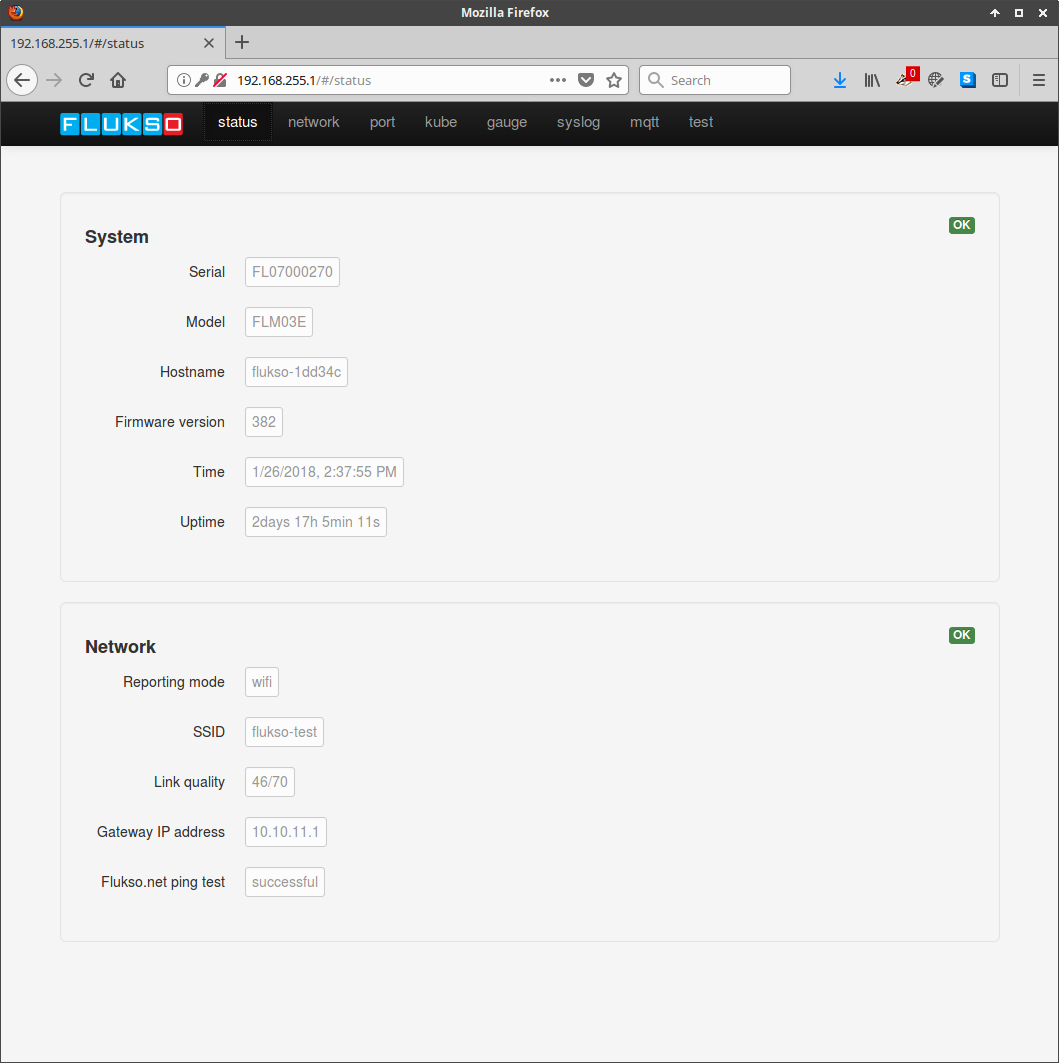
status
The status pages details system- and network-level information. Both sections should report an OK status in their top right corners. If not, an incorrect time setting and/or network issues will be reported.
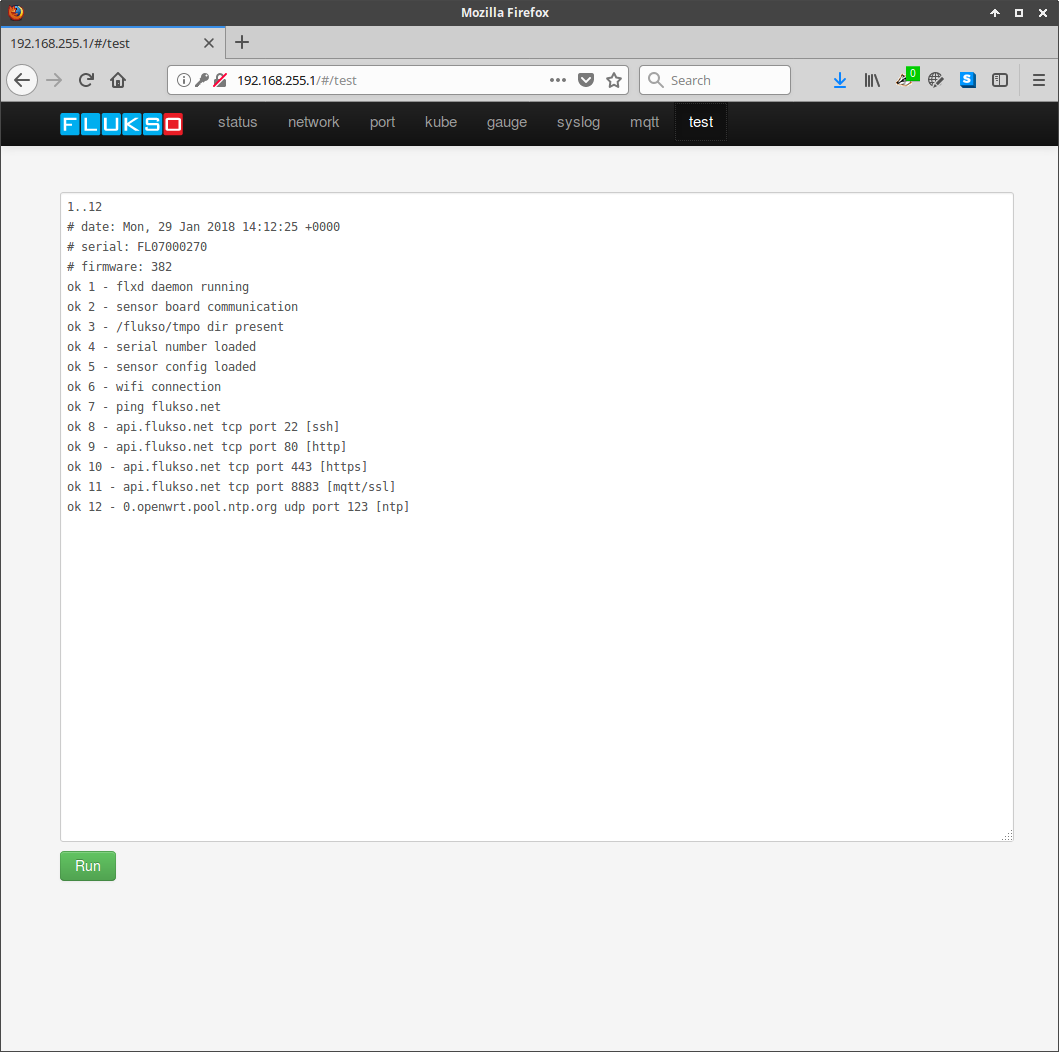
test
The test page provides further detail regarding the operational state of the Fluksometer. It’s an especially useful tool when debugging network issues. The batch of tests can be re-run by pressing the ‘run’ button. All test should report OK. Tests 8 through 12 check whether a firewall in the local network (if present) blocks any of the required tcp/udp ports. If any network ports are being blocked, please consult your network admin armed with the information from the test page.
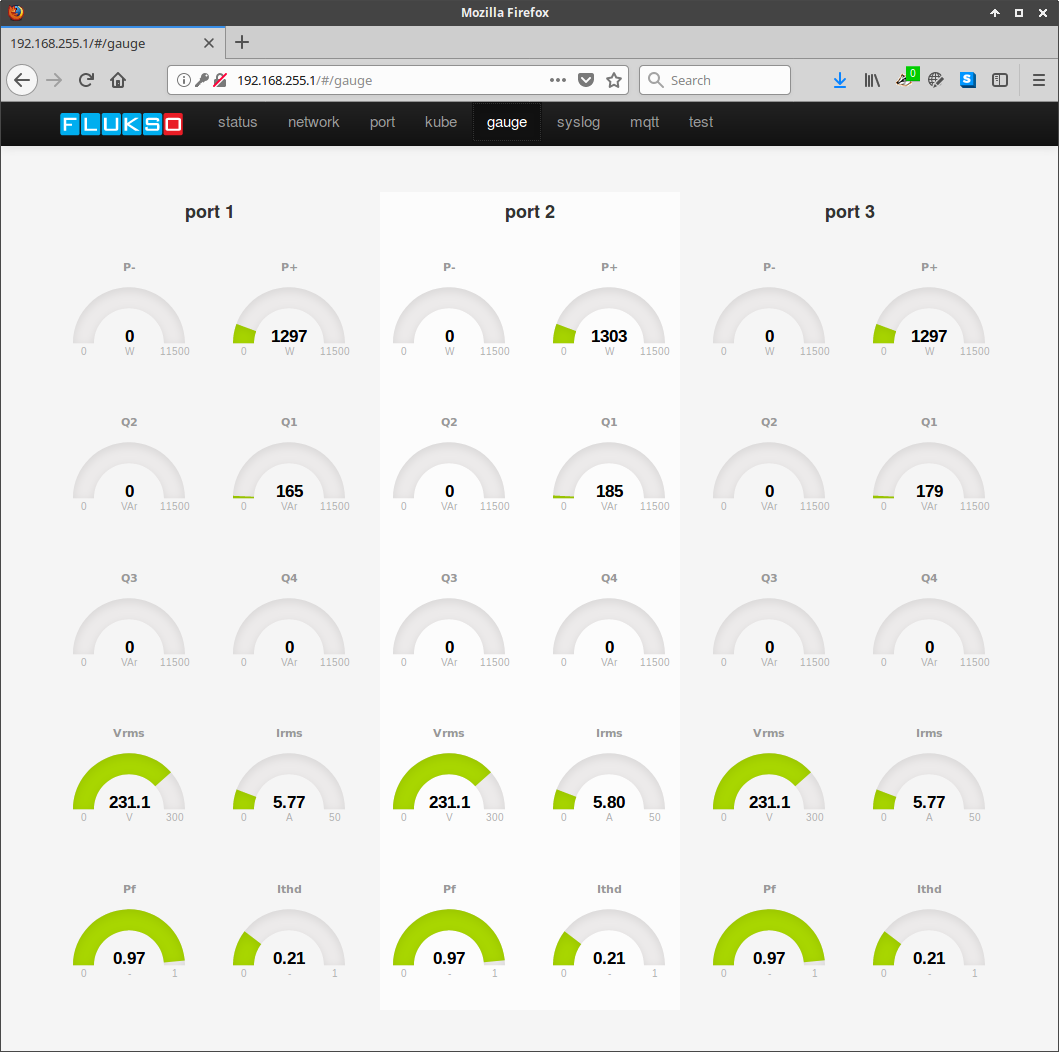
gauge
The gauge page renders a set of real-time metrics for each of the current clamp ports. Irms readings prove to be very useful when in doubt about the correct installation or configuration of the current clamps.
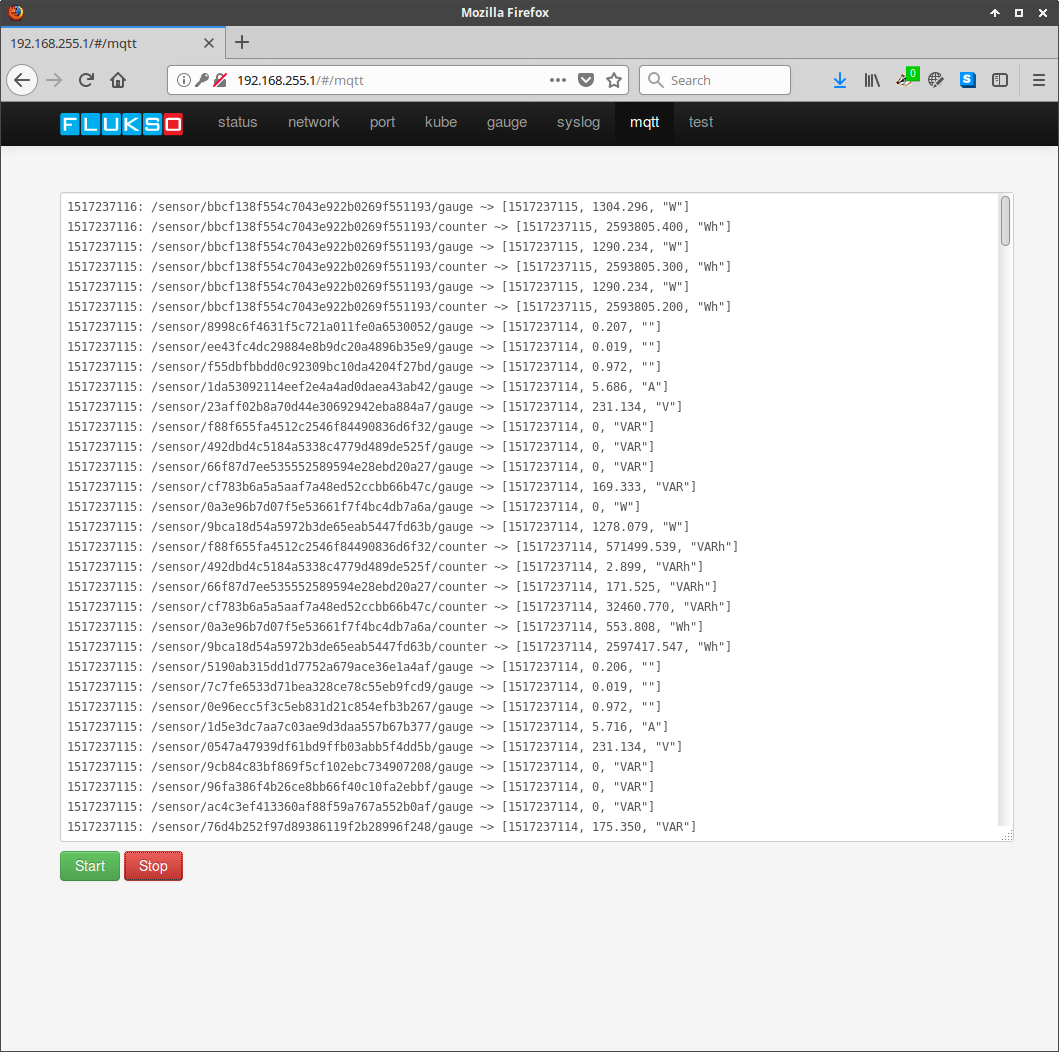
mqtt
Sensor messages published to the on-board MQTT broker are subscribed to by the mqtt page. It will display these messages anti-chronologically. You can pauze the output of the message flow at any time to give you ample time for inspecting the reported sensor readings.
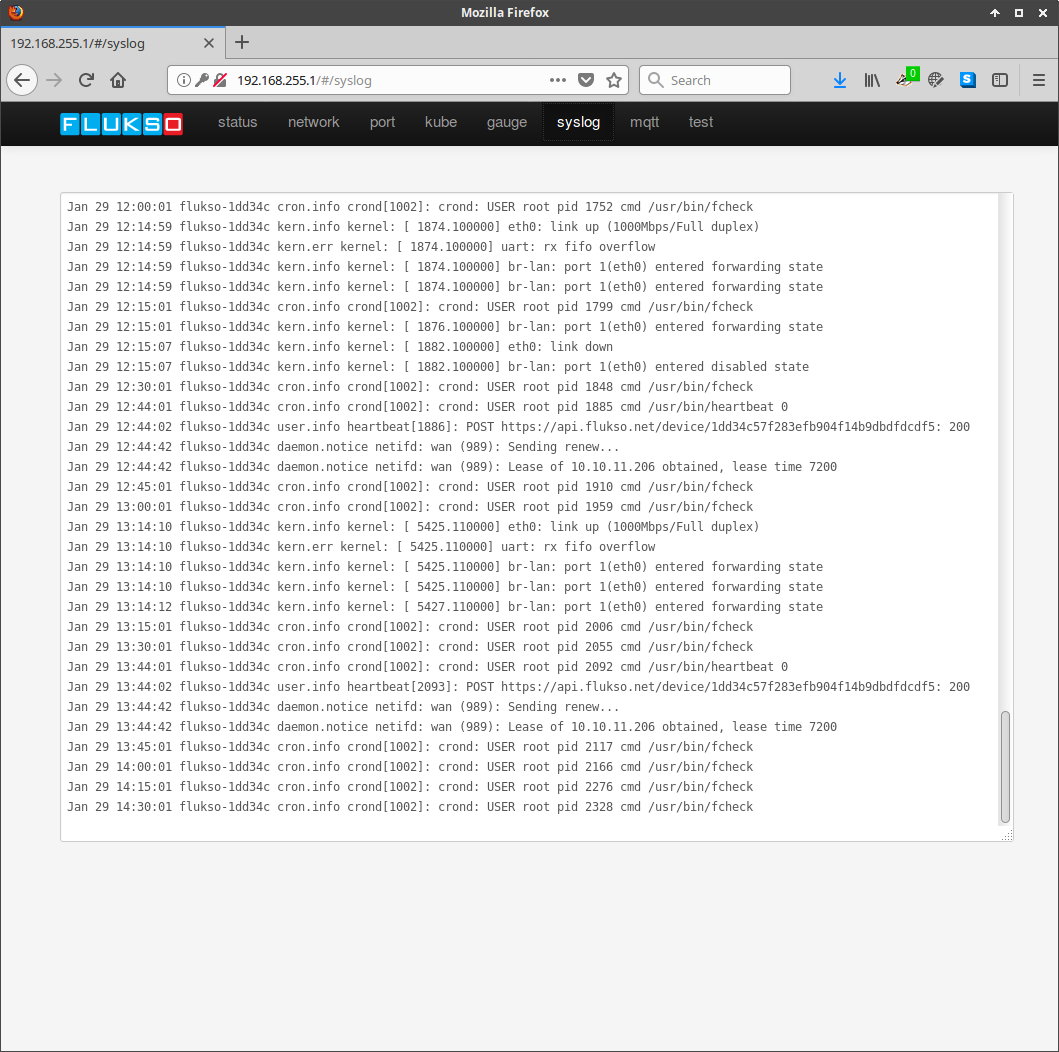
syslog
The syslog page shows the contents of the Linux syslog circular buffer, which might be helpful in some troubleshooting cases.