A New Year - A New Server

Last night we migrated the Flukso platform to a Linode VPS. The change should have rippled through the DNS hierarchy by now. Should you experience any connection problems with the Fluksometer then try to resolve it by resetting your broadband router first.

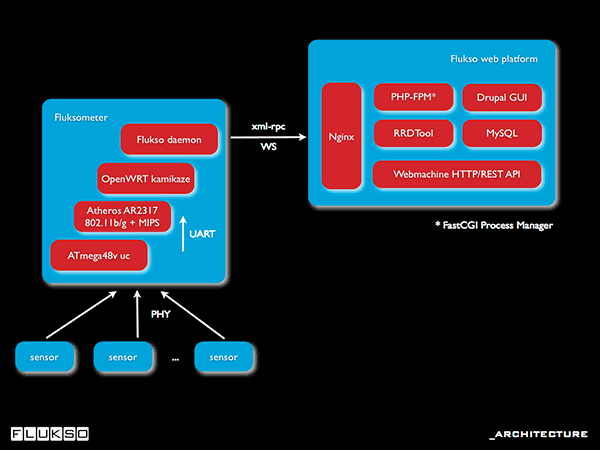
The site should be a lot snappier because of the new hardware. We've also taken the opportunity to change some of the platform's components. As can be seen in the architecture slide, Apache and mod_php have been substituted by Nginx and PHP-FPM. Our first experiences with Nginx have been very positive. It's stable, uses RAM sparingly and serves static content blindingly fast. We're also using it as a reverse-proxy to our Webmachine-based JSON/REST API. More about that in a later post.
Jon Gilkison's post on Nginx and PHP-FPM has been a great help for setting up the new server. Thanks!


Flukso's digest

Along with the setup of our forum, users with a Flukso account can now track the conversations on the site. Just surf to the 'my account' page, select the 'subscriptions' tag and unfold the 'settings' form. There's a plethora of settings made available allowing you to auto-subscribe, to subscribe to new forum content and comments, to aggregate the content into a digest, to set the digest's interval. Furthermore, each blog post or forum topic contains a 'subscribe' button near the bottom of the entry.

Happy reading!

Credits: The original picture is CC-BY-NC Tyla'75 on Flickr

Testing the new sensor board

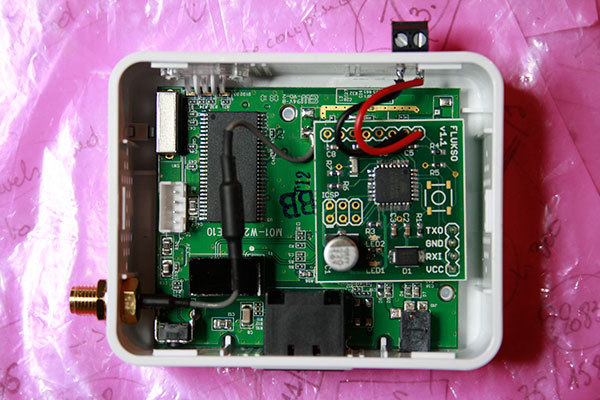
We're now shipping our Fluksometers with v1.1 of the sensor board. This board is a daughterboard that snaps onto a PCB containing an Atheros 2317 wifi chipset.

Fluksometer internalsFluksometer internals

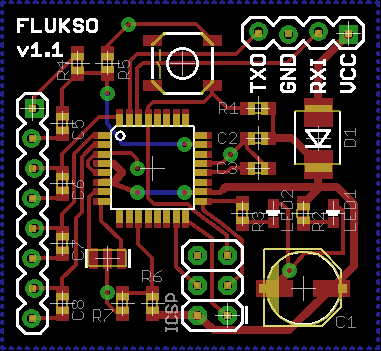
The boards communicate via the UART TXO and RXI lines. GND and VCC offer a 3.3V power supply to the sensor board. The board layout image below contains annotations detailing the sensor board's most important functions. More information can be found in the Eagle schematic and board layout files in the Flukso repository. A pdf of the schematic is attached to this blog post.

Flukso sensor board v1.1Flukso sensor board v1.1

What does the night tell you?

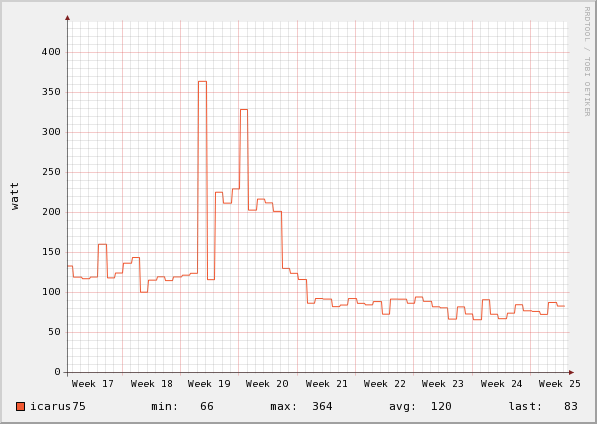
Here's a snapshot of our 'night' chart taken in the spring of '09. The data points on the Flukso night chart are calculated by taking the average electricity consumption between 2AM and 5AM local time. The chart gives us a good approximation of our household's 'leak power', i.e. the power that is being consumed by the house with no noticeable activity by its inhabitants. We can discern three periods on the chart. Weeks 17 and 18 show us an average nightly consumption of 130 watts. Week 19 and 20 show a sudden surge in the number of watts being used, to approximately 220 watts. The third period spans weeks 21 through 25 during which we observe a drop to about 80 watts.

Night ChartNight Chart

So can we tie these regions to events occurring in our house? Yes, we can. We swapped our old fridge for a brand-new, more efficient type at the start of week 21. This explains the drop of roughly 50 watts between periods one and three. The cause of the surge during period two wasn't that easy to explain at the time. We accidentally left our cellar light burning, an incandescent light bulb of 100 watts. Looking at this chart during week 20 made us realize we had an abnormal consumption. It took us a while to actually find what was going on, but without this type of visualization we might not have noticed this burning light bulb for another couple of weeks. This is one concrete case where monitoring your consumption can lead to a reduction in the electricity bill.

Note: We've added some Flickr-style annotations for the chart in this blog. Just roll your mouse over the area to view the comments on the chart.

Flukso enters beta!

After some nine months of alpha testing, we are very happy to announce that Flukso is now in beta. What does this mean for you? For starters, we have a first production batch of Flukso boxes available, ready to be installed. A Flukso box contains a Fluksometer that reports your home's electricity usage to the Flukso servers at five minute intervals. As such, you will be able to closely monitor your consumption through the online web application. We are displaying our own electricity consumption on the Flukso home page. If you're interested in purchasing a Fluksometer and joining our community, feel free to contact us through the contact form.

The Flukso StackThe Flukso Stack

Flukso is based on a number of high-quality open source software components, such as openwrt, rrdtool, drupal, apache, etc. We would like to conduct our development in the same philosophy. We have therefore released our custom code under the GNU GPL v2 license. The code, as well as the hardware schematics and layout of our sensor board can be found in the Jokamajo repository.