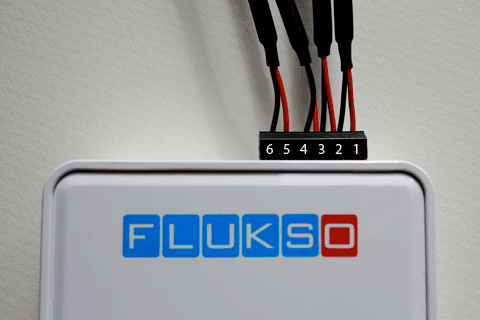
6-position screw terminal
by on
All pending and future Fluksometer orders during our beta phase will be made with a 6-position screw terminal block. A single-phase Fluksometer will thus be able to read out two independent current clamps and one digital S0-type pulse output. A pulse output is present on most DIN-rail based kWh energy meters. If such an energy meter has a constant of 1000imp/kWh or 1 pulse per watthour, then it can be directly connected to the Fluksometer. The clamps need to connect to positions 1(+)/2(-) and 3(+)/4(-), the pulse output to positions 5(+)/6(-).
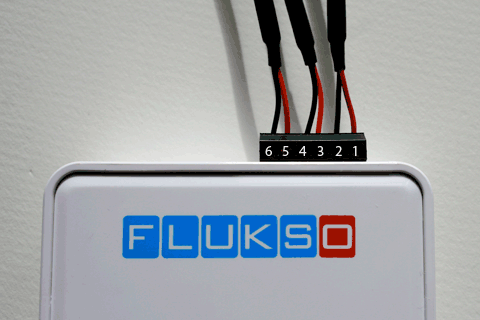
A three-phase Fluksometer with a 6-position connector will have its clamps connected in series. So clamp 1 will be on positions 1(+)/2(-), clamp 2 on 2(+)/3(-) and clamp 3 on 3(+)/4(-). Positions 5(+)/6(-) are again reserved for attaching a pulse output to the Fluksometer.
We currently only activate the 'main' input in the Flukso database. So either a single clamp (1-phase) or three clamps in series (3-phase). If you wish to experiment with additional inputs, let us know and we'll enable them in the database.
Note: This is not an April fools' joke!